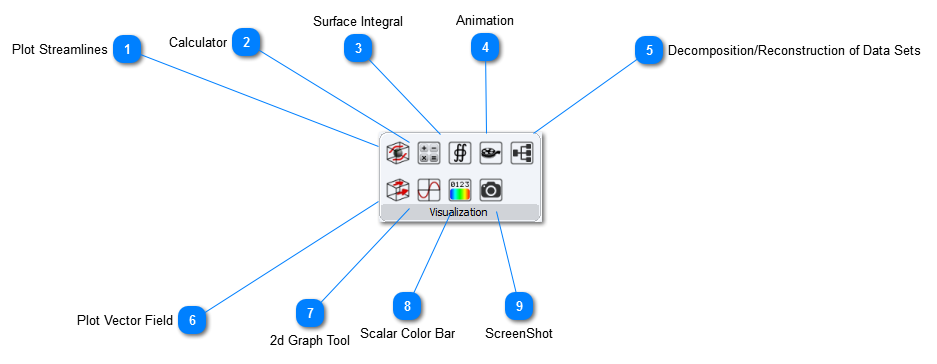
Plot StreamlinesPlot streamlines
|
|
 CalculatorCalculate new fields
|
|
 Surface IntegralIntegrate new fields
|
|
 AnimationAnimate results
|
|
 Decomposition/Reconstruction of Data SetsToggle between decomposed or reconstructed data sets
|
|
 Plot Vector FieldPlot vector field
|
|
 2d Graph ToolPlot 2D Graphs
|
|
 Scalar Color BarInsert scalar color-bar
|
|
 ScreenShotTake a snapshot of the screen
|
|