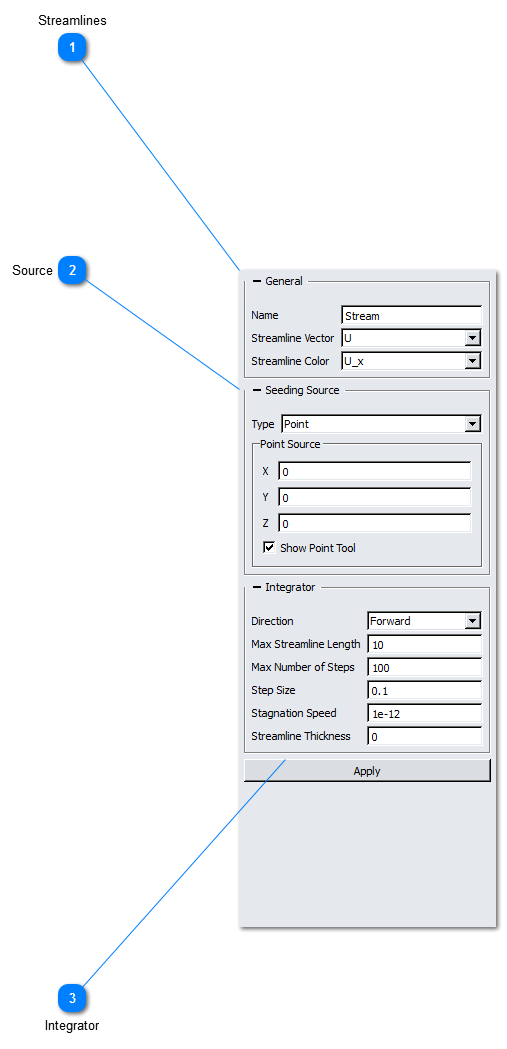
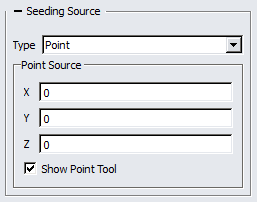
Use this control to enter the source for the streamline (s) . This can be a point, a line , a sphere or a boundary. The boundary is computed as the boundary of a group.
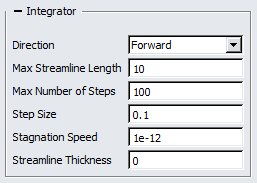
This control governs the integration of the streamline. The direction of the integration can be forward( downstream) , backward (upstream ) or both. The integration is performed until either the max length or the max number of steps has been reached for the given step size. The stagnation speed is a threshold below which zero velocity is assumed.