To properly display this page you need a browser with JavaScript support.
Ennova
User guide
[Edit...]
×
Menu
Index
Search
Search
Search
Ennova Interface Guide
Tools Function Ribbon
Post Process (IconCFD users only)
User Parts
Threshold Plot
Previous page
Next page
(c) Company name, 2016
To properly display this page you need a browser with JavaScript support.
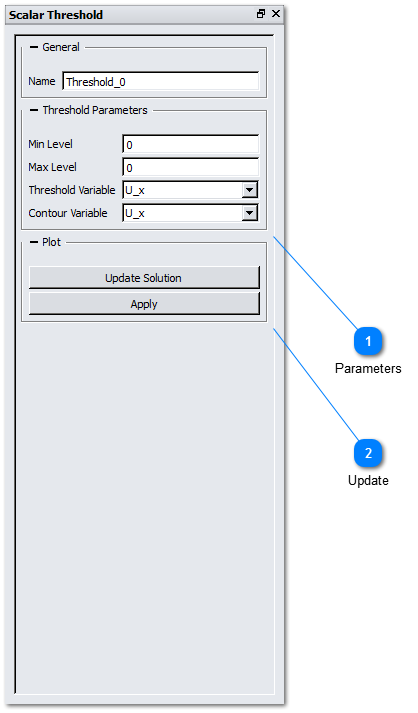
Threshold Plot
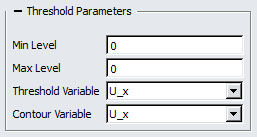
Parameters
Use this control to define an minimum and maximum threshold. Again the contours can be plotted with an alternative variable
Top
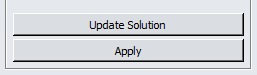
Update
Update the plot here
Top
The online help was created with Dr.Explain